

Your MarketMetrics, Grower Edition
Explore: Meet the Expert / What You Get / Pricing / Data & Metrics
We’ve heard it for years: “the nursery & greenhouse industry needs better benchmarking data.”
Your MarketMetrics will allow you to easily “see” how your company is doing compared to your peers, identify critical industry trends, and allow you to make meaningful business decisions to drive better profitability and financial stability.
Your MarketMetrics is online, private, visual, filterable … and best of all, ACTIONABLE.
The project represents more than 70 nursery and greenhouse growers from across the US, representing more than $3 billion in aggregated annual production and data for key business metrics going back to 2015. We onboard subscribers only twice annually, to enable them to get personalized service as they learn the reporting system.
Want a sample of the kind of info you’ll get? Click HERE to download a complimentary “Index of Prices Paid By Growers” report and the most recent Summer Supplement from 2025 (which looks ahead to 2026 with two tariff scenario predictions) — to demonstrate the type of insights this program can generate to help you move your own productivity forward.
Current subscriptions are always open, we will onboard you personally to catch you up with the current period of data collection: join us today!
Your Industry Expert, Dr. Charlie Hall
The Grower community within Your MarketMetrics is led by Dr. Charlie Hall, who grew up on a nursery in Western North Carolina. An economist by training, he is currently a Professor in the Department of Horticultural Sciences at Texas A&M University and holder of the Ellison Chair in International Floriculture. He is the lead faculty member of the Executive Academy for Growth & Leadership (EAGL), an exclusive certification program for industry-leading growers, and serves as the Chief Economist for AmericanHort. He is proud to shepherd and steward this critical industry data comparison initiative.

Data & Metrics
What are the KPI metrics you should be calculating and comparing? Each year, we introduce an expanded but manageable set of data to be captured so that by the end of the rollout, a comprehensive managerial-focused benchmarking system will be in place.
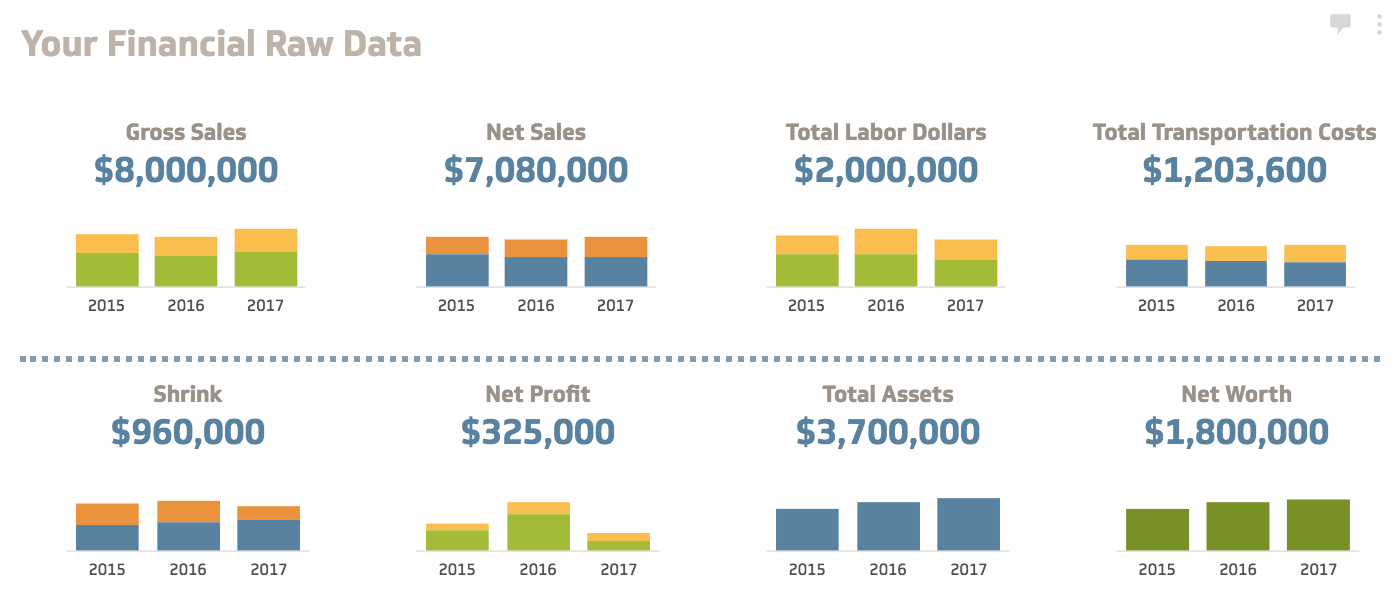
Sample Data Collected
Gross sales
Net sales (net sales/total assets)
Net profit (earnings after taxes)
Total assets
Net worth
Transportation dollars
Shrink dollars
Total payroll dollars (wages & salaries)
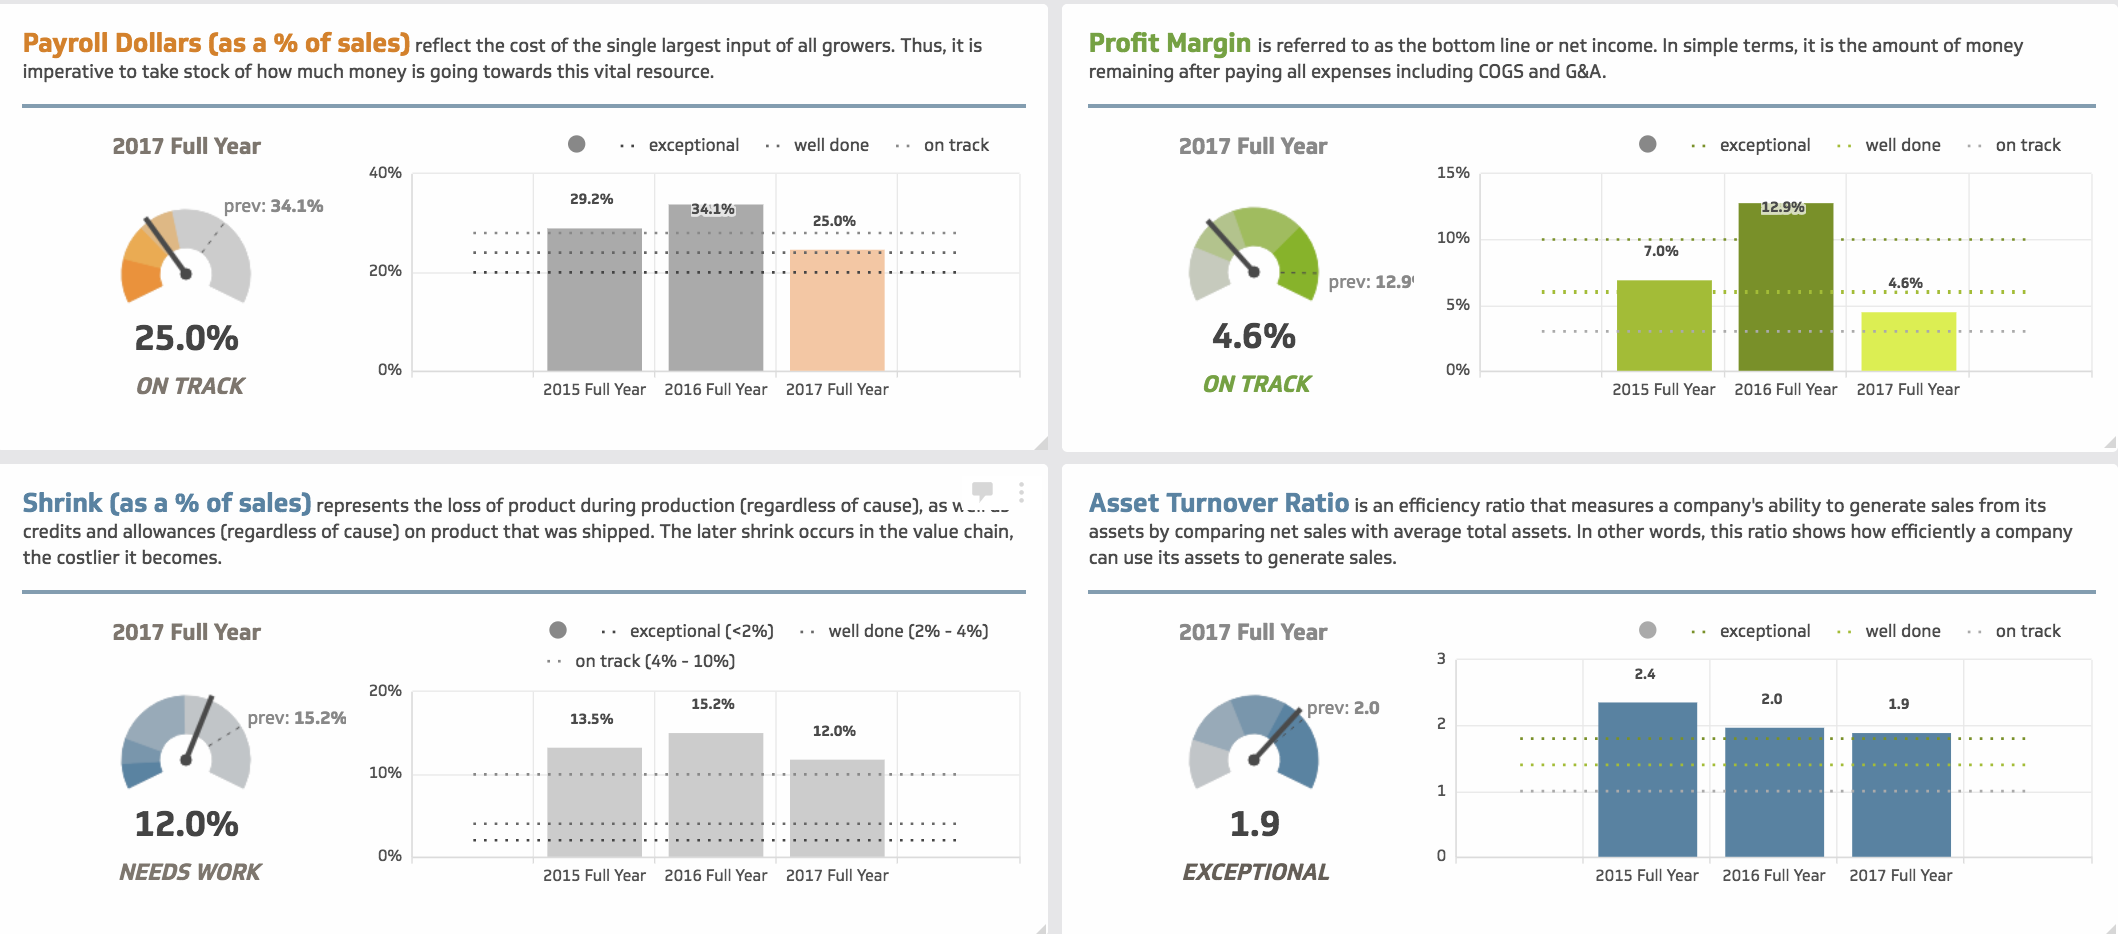
Sample KPIs Calculated
Profit margin (net profit/sales)
Asset turnover (gross less discounts/allowances)
Financial leverage (total assets/net worth)
Payroll dollars (as % of sales)
Shrink (as % of sales)
Transportation (as % of sales)
Return on assets
Return on equity
Measuring “apples to apples” is important to make this information as valuable as possible. Need more coaching on how to get started? Click HERE to watch a 24 minute tutorial from Charlie on the data collection numbers which will get you started.
Subscription Highlights

Your Subscription Includes
- Personalized login accounts for 4 team members
- Filterable KPI comparison dashboards
- Private company dashboard (your OWN performance, period over period)
- Aggregated historic industry trends back to 2015
- Access to critical new metrics as they are added (see 4-year rollout calendar)

Plus. . . Expert Insights
You’ll get “Subscribers Only” insights from Dr. Charlie Hall, to help you understand what you’re seeing on the comparison dashboards.
- Exclusive debriefing webinar on industry margin analysis whitepaper (February)
- KPI Key Learnings Report (downloadable) and debriefing webinars (live and recorded) after each data collection period (April and September)
- Invitation to a subscribers-only “Charlie’s Insights” intensive session at Cultivate annually (July)
Your Investment
Subscription onboarding is closed. Add your name to the list on the right to receive notifications
when the next round of subscriptions is available.
Join the Notification List

Most importantly, you will make an informational investment. (No one can just “pay to take a look” – everyone submits their own information first.) You will download a submission spreadsheet and submit your raw data in 6-month increments, following the glossary to get “apples to apples” and the system will do the KFI calculations to yield comparable percentages for each metric. If you need assistance in aligning your numbers, our team is standing by to help!
ONBOARDING
Requires 6 years of data, in 6-month increments going back to January 2015. NEW eighth round participants will submit data from 2015 through the end of most recent year. Upon receipt of data, full historic insights reports on all comparable data (through YE 2023) will be available, and a personal set of video comments from Dr. Hall will be created for your company’s review on your private dashboard.
$2,950
Annual Renewal*
Your membership will renew a year after your initial onboarding at $1950, concurrent with that next data submission.